In the long run, there are strong incentives for Balinese farmers to cooperatively manage their rice terraces. But over the short term, cooperation within subaks sometimes falters; usually briefly but occasionally permanently. Can we catch these failures ‘on the fly’?
Managing rice paddies is a complicated business requiring ongoing collective action, not just of agricultural labor, but also a heavy burden of ritual obligations. Too little investment in the subak may incur crop losses; too much investment may incur the wrath of one's family. Subaks vary in their ability to increase or decrease these investments as conditions dictate. When the capacity of a subak declines, it becomes vulnerable. Such failures of cooperation may be temporary – crop losses may prompt a return to high investment, or they may be permanent – leading to the collapse of the subak. Curiously, low investment in the subak can have two interpretations: it may mean the farmers are enjoying a period of low stress; or it may instead imply that a subak is close to collapse. How can we tell these scenarios apart?
Managing rice paddies is a complicated business requiring ongoing collective action, not just of agricultural labor, but also a heavy burden of ritual obligations. Too little investment in the subak may incur crop losses; too much investment may incur the wrath of one's family. Subaks vary in their ability to increase or decrease these investments as conditions dictate. When the capacity of a subak declines, it becomes vulnerable. Such failures of cooperation may be temporary – crop losses may prompt a return to high investment, or they may be permanent – leading to the collapse of the subak. Curiously, low investment in the subak can have two interpretations: it may mean the farmers are enjoying a period of low stress; or it may instead imply that a subak is close to collapse. How can we tell these scenarios apart?
|
Lansing JS, Chung NN, Jacobs GS, Chew LY. 2018. Transitions between regimes in Balinese subaks. In preparation.
|
Chapter 8 in the book explores key social features that drive the success vs failure of subaks. Farmers were surveyed about harvest yields, water shortages and pest infestations (environmental challenges), and about their opinions of social factors that affect the ability of the subak to respond to both social and environmental problems (social challenges). These factors include the effectiveness of sanctions against norm violators; the ability of the subak to mobilize collective labor to maintain the irrigation works; engagement with temple rituals; the general condition of the subak; and its capacity to cope with technical and social problems.
Survey results such as these can be analyzed using principal component analysis (PCA), which tells us which factors are most to least influential to the state of the subak. A PCA on our survey data reveals two clusters of subaks – one group doing well, the other ‘muddling through’. Although the subaks all experience similar social and environmental conditions, they respond to them in different ways. In successful subaks, farmers speak positively about the effectiveness of sanctions, the ease of raising manpower, engagement with community meetings, and the overall condition and resilience of the subak. These differences are only recognizable through a cross-scale comparison; they are invisible in analyses both of individual subaks and of the system as a whole.
The two states that subaks fall into are called regimes, and they tell us something about the inner workings of these communities. The more successful subaks flourish in a small, but deep, basin of attraction. Confident of their collective ability to meet any challenge, they are exceptionally cooperative. The less confident group of subaks appear to cluster around their own attractor, with different dynamical relationships, but reveal that `muddling through' may sometimes also be a reasonable strategy.
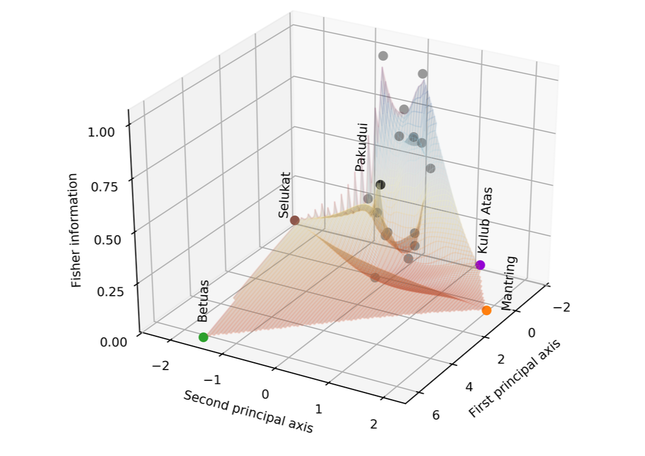
To understand these attractors more, we can combine PCA with Fisher Information. Fisher Information measures the amount of information that an observable variable X has about an unknown parameter θ in a given model. A major advantage of Fisher Information is that it does not assume that correlations are linear; it instead characterizes the probability distribution of each descriptor. By combining PCA and Fisher Information, we can begin to visualize regimes of stability in our dynamical system.
The Fisher Information landscape for the subaks appears in the following figure. The x and y axes represent the first and second principal components, and show that the responses of the farmers to the survey questions are widely dispersed. The z axis presents the Fisher Information. Most subaks fall into a single small cluster with high Fisher Information, which suggests that farmers in most subaks think similarly about their communities. But four subaks are outliers; they have low Fisher Information, implying that farmers within those subaks have more variable responses to the survey questions, which in turn differ from the responses of farmers in the main cluster.
Survey results such as these can be analyzed using principal component analysis (PCA), which tells us which factors are most to least influential to the state of the subak. A PCA on our survey data reveals two clusters of subaks – one group doing well, the other ‘muddling through’. Although the subaks all experience similar social and environmental conditions, they respond to them in different ways. In successful subaks, farmers speak positively about the effectiveness of sanctions, the ease of raising manpower, engagement with community meetings, and the overall condition and resilience of the subak. These differences are only recognizable through a cross-scale comparison; they are invisible in analyses both of individual subaks and of the system as a whole.
The two states that subaks fall into are called regimes, and they tell us something about the inner workings of these communities. The more successful subaks flourish in a small, but deep, basin of attraction. Confident of their collective ability to meet any challenge, they are exceptionally cooperative. The less confident group of subaks appear to cluster around their own attractor, with different dynamical relationships, but reveal that `muddling through' may sometimes also be a reasonable strategy.
To understand these attractors more, we can combine PCA with Fisher Information. Fisher Information measures the amount of information that an observable variable X has about an unknown parameter θ in a given model. A major advantage of Fisher Information is that it does not assume that correlations are linear; it instead characterizes the probability distribution of each descriptor. By combining PCA and Fisher Information, we can begin to visualize regimes of stability in our dynamical system.
The Fisher Information landscape for the subaks appears in the following figure. The x and y axes represent the first and second principal components, and show that the responses of the farmers to the survey questions are widely dispersed. The z axis presents the Fisher Information. Most subaks fall into a single small cluster with high Fisher Information, which suggests that farmers in most subaks think similarly about their communities. But four subaks are outliers; they have low Fisher Information, implying that farmers within those subaks have more variable responses to the survey questions, which in turn differ from the responses of farmers in the main cluster.
Fisher Information further tells us that there are three classes of descriptors: cooperation, defection, and social. The cooperative class have correlated descriptors that depend directly or indirectly on the cooperativity of the farmers. In contrast, the defection class is anti-correlated with the cooperation descriptors, and mostly reflect practical problems, such as limited water availability and a high proportion of sharecroppers versus landowners. The social class is more related to social disharmony, is uncorrelated with the cooperation and defection classes, and is dominated by descriptors in the social domain, including social conflict, caste problems, and a high frequency of water theft. In the following three videos, you can explore how the cooperation (upper), defection (middle), and social (lower) classes of descriptors vary among the subaks.
Do these outlier subaks have their own discrete regime, or are they just randomly divergent? To find out, we can dissect their responses to the survey further. Sixteen subaks are closely clustered in their own attractor; these are the most successful and cooperative subaks. They are dominated by positive values for cooperation, including synchronized cropping, strong meeting attendance, and reliable work participation. But as Tolstoy observed in Anna Karenina, while happy families are all alike, every unhappy family is unhappy in its own way. The unsuccessful subaks are distributed across two different attractors. The first is dominated by resource limitations, in particular pest damage and water shortages. The second is dominated by social disharmony, with problems of caste, class and social conflict.
Which brings us to our main question: can the survey data provide insight into which variables dominate transitions between the cooperative regime and the states of the unsuccessful subaks?
An answer is possible using a well-known model from physics, an energy landscape, which lets us ascertain which descriptors dominate the most likely transition paths between attractors. The energy landscape for our subaks is shown in the video below. The attractor of the successful subaks is the steepest and deepest basin in both the energy landscape and the Fisher Information landscape. It is therefore stable and robust, just as expected from the positive tone of the farmers’ answers. But what unhappy paths must be taken for subaks to fail? To reach the subaks plagued by resource limitations, poor water availability is key. In contrast, social strife leads the way to the disharmonious subaks. The attractor of successful subaks appears to be the only stable regime; the others are less well defined and are likely in a state of transience. In coupled social-ecological systems, getting out of sync with your environment or your community are both paths to woe.
We emphasize that these results have relevance far beyond the Balinese case. The discovery and analysis of regimes in social science has been hampered by the fact that the analytical models and statistical techniques conventionally used by social scientists assume that samples are drawn from uniform statistical distributions. Often they are not. This assumption hides out-of-equilibrium dynamics and makes it difficult, if not impossible, to observe the presence of more than one regime. In coupled social-ecological systems, where both social and environmental factors can interact in complex non-linear ways, it is always possible for alternate steady states to exist. The methods laid out here provide one possible approach to untangle these interacting effects.
On the other pages of this website, we asked specific questions about the topic immediately at hand. Here, we instead ask you to consider the bigger picture. How might the methods you are now familiar with be used in your own research? What complex dynamics might be acting in your own data, and how could you find out? What other islands of order are out there?
On the other pages of this website, we asked specific questions about the topic immediately at hand. Here, we instead ask you to consider the bigger picture. How might the methods you are now familiar with be used in your own research? What complex dynamics might be acting in your own data, and how could you find out? What other islands of order are out there?