In traditional societies, men and women often lead quite different social roles. A key distinction is that movement from one community to another is mostly motivated by marriage, and communities often set strict rules about who moves and who stays.
Broadly, there are four possibilities:
These dispersal practices have different social and genetic consequences. In terms of genetics, the differences are most easily seen in patterns of genetic diversity on the mitochondrial DNA, which is inherited only through women, and the Y chromosome, which is inherited only through men.
One way to track these differences is to plot genetic similarity on the mitochondrial DNA versus the Y chromosome. Although matrilineal descent can be inferred for both men and women from their maternally inherited mtDNA, patrilineal descent must be traced with the Y chromosome, carried only by men. Therefore, only men are considered in the plots below.
The following figure shows typical computer simulations from the four marriage systems, in a series of paired genetic distance plots developed by Lansing et al. (2017). To make these plots, each individual is paired with every other individual, and each pair is represented by a single point corresponding to how closely those two individuals are related on both their mtDNA (matriline) and Y (patriline).
Broadly, there are four possibilities:
- all individuals marry and reside within the same community (endogamy),
- individuals marry and live outside their natal community (ambilocality or neolocality),
- men remain in their natal community and women disperse (patrilocality), or
- women remain in their natal community and men disperse (matrilocality).
These dispersal practices have different social and genetic consequences. In terms of genetics, the differences are most easily seen in patterns of genetic diversity on the mitochondrial DNA, which is inherited only through women, and the Y chromosome, which is inherited only through men.
One way to track these differences is to plot genetic similarity on the mitochondrial DNA versus the Y chromosome. Although matrilineal descent can be inferred for both men and women from their maternally inherited mtDNA, patrilineal descent must be traced with the Y chromosome, carried only by men. Therefore, only men are considered in the plots below.
The following figure shows typical computer simulations from the four marriage systems, in a series of paired genetic distance plots developed by Lansing et al. (2017). To make these plots, each individual is paired with every other individual, and each pair is represented by a single point corresponding to how closely those two individuals are related on both their mtDNA (matriline) and Y (patriline).
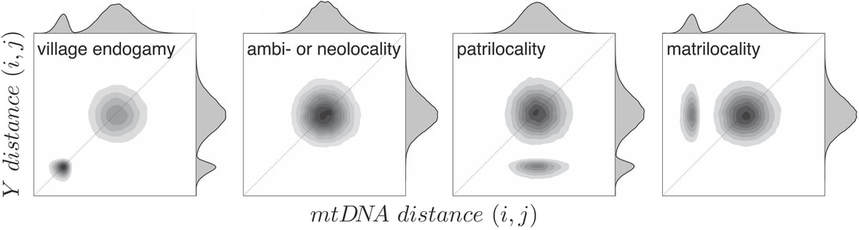
In the simplest cases (endogamy, and ambi– or neolocality) (the two leftmost figures), there is no bias towards matri– or patrilineal relatedness. Consequently, given equal mutation rates, the distribution of pairwise mtDNA and Y chromosome distances falls on the one-to-one correlation line, at a distance from the origin that depends on demographic parameters (e.g., the size of the village).
However, if both women and men marry and live within their natal villages, we instead see two clusters of pairwise genetic distances
However, introducing a matrilocal or patrilocal bias in marriage customs (the two rightmost figures) shifts the pairwise distance plot towards one axis or the other. In patrilocal villages, where men remain in their natal villages while women move to marry, pairs of men remain closely related on their Y chromosome, but not their mtDNA. The opposite holds for matrilocal villages where women remain in their natal villages and men move after marrying.
This is all well and good, but what happens in the real world? In tribal societies on the eastern Indonesian islands of Sumba and Timor, traditional settlement structures are still largely intact, and this history is reflected in the DNA of the people living there today.
The following figure shows two examples.
However, if both women and men marry and live within their natal villages, we instead see two clusters of pairwise genetic distances
- one near the origin, a cluster of closely related kin residing in the same village, and
- a larger cluster consisting of individuals who live in different villages, and are thus less closely related.
However, introducing a matrilocal or patrilocal bias in marriage customs (the two rightmost figures) shifts the pairwise distance plot towards one axis or the other. In patrilocal villages, where men remain in their natal villages while women move to marry, pairs of men remain closely related on their Y chromosome, but not their mtDNA. The opposite holds for matrilocal villages where women remain in their natal villages and men move after marrying.
This is all well and good, but what happens in the real world? In tribal societies on the eastern Indonesian islands of Sumba and Timor, traditional settlement structures are still largely intact, and this history is reflected in the DNA of the people living there today.
The following figure shows two examples.
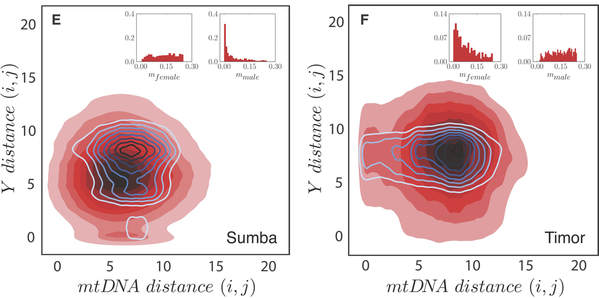
On the island of Sumba (left), all of the sampled communities are patrilocal, and the observed pattern (blue contour lines) shows a distinctive 'blip' towards the bottom of the plot, as expected from the computer simulations for patrilocality. (For comparison, the red cloud shows genetic data simulated under the best-fitting patrilocal model).
In contrast, most of the communities in the Wehali cluster in central Timor (right) are matrilocal. This plot instead shows a distinctive 'blip' towards the left, just as expected from the computer simulations for matrilocality.
How sensitive are these patterns? And do they change from one community to the next?
You can explore the processes behind the patterns by setting different migration rates for men and women, and different sizes and numbers of communities, in the following app. Data simulated under the model you choose are shown in pink (mitochondrial DNA) and purple (Y chromosome). Note that the zero point, where individuals are genetically identical, is in the upper right here, diagonally flipped relative to the figures plotted above. By toggling the population labels, you can overlay the genetic diversity patterns that we actually observe on Sumba and Timor (grey points).
Questions:
- What happens when women move, but men do not? Or when men move, and women stay? What happens when both men and women move at similar rates? Or when no one moves at all?
- What patterns appear when the village is big? Or small? When there are many villages, or few?
- How do the 'village' parameters interact with the 'migration' parameters? Can you see any trends?
References:
Lansing JS, Abundo C, Jacobs GS, Guillot EG, Thurner S, Downey SS, Chew LY, Bhattacharya T, Chung NN, Sudoyo H, Cox MP. 2017. Kinship structures create persistent channels for language transmission. Proceedings of the National Academy of Sciences USA 114:12910-5.
Lansing JS, Abundo C, Jacobs GS, Guillot EG, Thurner S, Downey SS, Chew LY, Bhattacharya T, Chung NN, Sudoyo H, Cox MP. 2017. Kinship structures create persistent channels for language transmission. Proceedings of the National Academy of Sciences USA 114:12910-5.