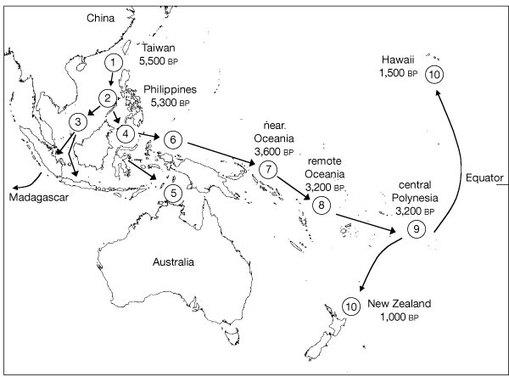
The expansion of Austronesian speaking peoples into Island Southeast Asia and the Pacific Ocean was the last and most far-reaching prehistoric human migration. Austronesian languages replaced indigenous languages over nearly half the globe. Yet the absolute number of Austronesian colonists was always small.
Reference: http://doi.org/10.1038/35016575
Geneticists have identified large geographic disparities in the relative proportions of Asian versus Papuan ancestry across different genetic systems, notably the mitochondrial DNA, X chromosome, autosomes and Y chromosome. Given the lack of geographical barriers or clear evidence for natural selection, this process of population mixing likely emerged from social behavior.
Drawing on decades of comparative ethnological research inspired by F. A. E. van Wouden's structural model of Austronesian social organization, later codified by Claude Lévi-Strauss as "House societies" (sociétés à maison), we proposed a two-stage ethnographic model in which the appearance of matrilocal “House societies” during the initial phase of the Austronesian expansion, and the subsequent disappearance of "House societies" in lowland rice-growing regions, accounts for the observed linguistic, genetic and cultural patterns (Lansing et al. 2011).
Drawing on decades of comparative ethnological research inspired by F. A. E. van Wouden's structural model of Austronesian social organization, later codified by Claude Lévi-Strauss as "House societies" (sociétés à maison), we proposed a two-stage ethnographic model in which the appearance of matrilocal “House societies” during the initial phase of the Austronesian expansion, and the subsequent disappearance of "House societies" in lowland rice-growing regions, accounts for the observed linguistic, genetic and cultural patterns (Lansing et al. 2011).
If we specifically look at the allele frequencies of Asian markers in the eastern Indonesian islands of Sumba, Flores and Timor, as well as further east in Polynesia, we see a characteristic pattern.
Asian markers are most frequent on the mitochondrial DNA (inherited only through women), then on the X chromosome (which spends two-thirds of its time in women, but only one-third in men), then on the autosomes (which spend equal time in men and women), and finally on the Y chromosome (inherited only through men). This pattern suggests that Asian women made it as far as Polynesia, while in large part, Asian men did not.
These differences can be captured to a surprising extent by very simple equations with just two parameters: α, the admixture rate, and t, the duration of admixture (in generations). Expectations for the mitochondrial DNA are fixed, but expressions for the X chromosome, autosomes and Y chromosome are
\[ Y_{t} = {\big({{1-\alpha}}\big)}^t \]
\[ A_{t} = {\bigg({\frac{1-\alpha}{2}}\bigg)}^t \]
\[ X_{t} = {\bigg({\frac{1-\alpha}{3}}\bigg)}^t \]
Explore for yourself how different values of the admixture rate α and admixture duration t interact to produce these characteristic patterns.
Questions:
- Find which values of α and t produce curves that most closely resemble the patterns seen for Sumba, Flores, Timor and Polynesia. (Note that the equations do not capture all of the complexity in the genetic data).
- Explore whether the data are most consistent with an admixture bias towards Asian women or Asian men, or whether there was no bias to either sex.
Note that the allele frequencies of Asian markers, like those seen in eastern Indonesia and Polynesia, can be obtained through either
- high rates of admixture over a few generations, or
- low rates of admixture over many generations.
References:
Lansing JS, Cox MP, de Vet TA, Downey SS, Hallmark B, Sudoyo H. 2011. An ongoing Austronesian expansion in Island Southeast Asia. Journal of Anthropological Archaeology 30:262-72.
Lansing JS, Cox MP, de Vet TA, Downey SS, Hallmark B, Sudoyo H. 2011. An ongoing Austronesian expansion in Island Southeast Asia. Journal of Anthropological Archaeology 30:262-72.